
Advanced Data Analytics
ML, predictive modeling, and statistical analysis to uncover patterns and actionable insights.
PythonRSQLTableauPower BI
Transform your business with cutting-edge BI analytics, advanced data visualization, and intelligent reporting solutions that drive strategic decision-making and accelerate growth.
ML, predictive modeling, and statistical analysis to uncover patterns and actionable insights.
Real-time KPI monitoring and executive reporting for data-driven decisions across the org.
Scalable DWH, ETL, and data lake design for centralized management and high-performance analytics.
Forecasting, segmentation, and automation using robust ML pipelines.
Reliable pipelines, quality checks, and orchestration for seamless analytics.
Automated reporting, scorecards, and C-level dashboards.
Real-time sales analytics, inventory optimization, and customer behavior insights. +25% revenue impact.
Automated P&L, budget tracking, and predictive models for banking analytics.
IoT-integrated monitoring, quality dashboards, and predictive maintenance (−40% downtime).
Clinical visualization, outcomes analysis, and operational efficiency dashboards.
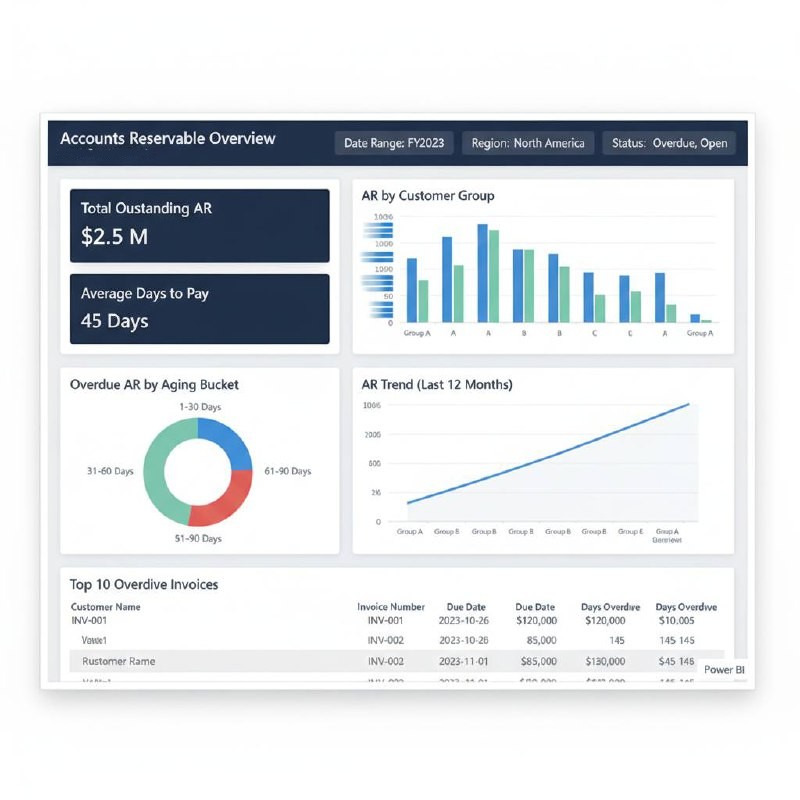
See total outstanding AR, DSO, aging buckets, and trend by customer group. Typical impact: -5–12 days DSO, improved collections prioritization, and cash-flow predictability.
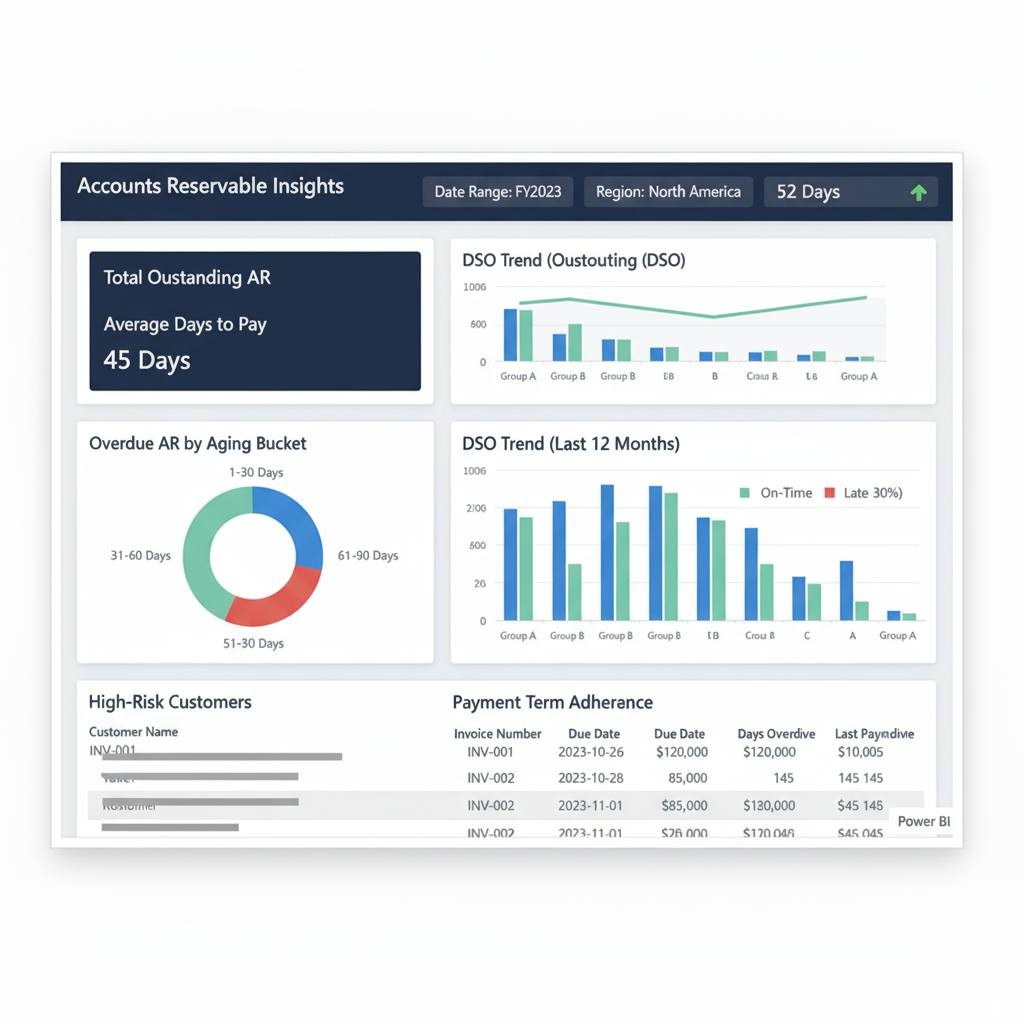
Drill into high-risk customers and payment term adherence to target the right follow-ups. Result: faster dispute resolution, fewer write-offs, and a healthier cash cycle.
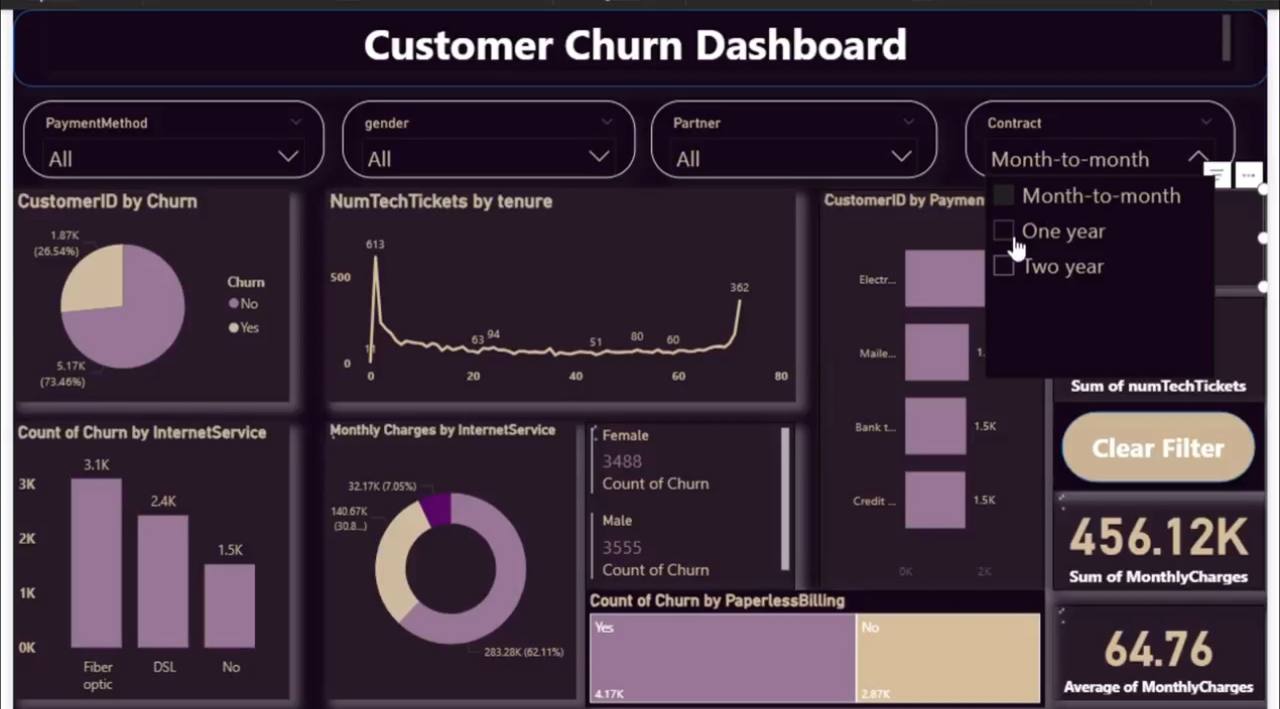
Identify churn drivers (plan, tenure, billing) and track retention campaigns. Expect 2–6% churn reduction by focusing on high-risk segments and early interventions.
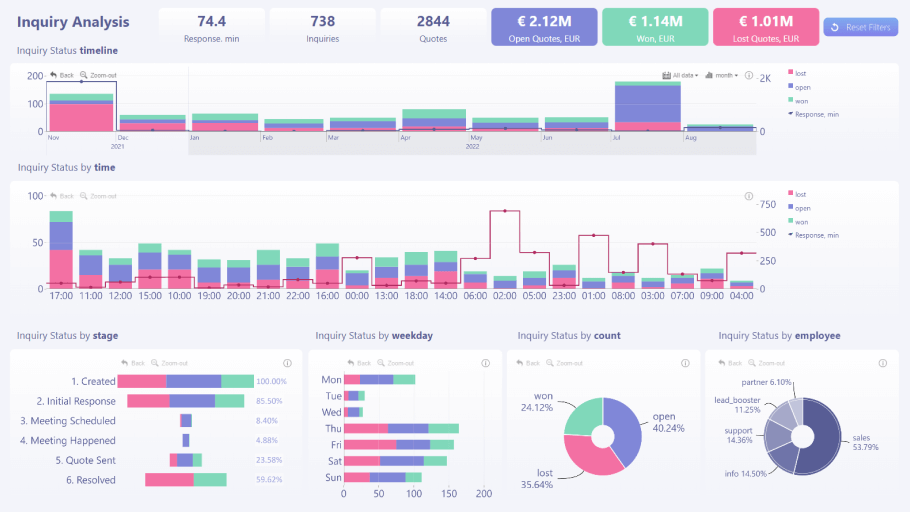
Visualize response times, pipeline stages, and win/loss drivers by hour and weekday. Typical gains: +8–18% win rate and shorter lead-to-quote cycles.
We are a specialized Business Intelligence and Analytics company dedicated to transforming data into strategic business value. With deep expertise in advanced analytics, data visualization, and BI platforms, we empower organizations to make data-driven decisions that drive growth and operational excellence.